In a bid to increase visits to University of Sunderland’s website, Technical Services have developed a way to help.
To help improve traffic and interactivity on the University website, created by our web team so you can see who, when, why and how many people access the University’s websites. This is known as a ‘performance dashboard’, and it was developed with the help of Google Data Studio. and allows those who run the website to view several different metrics.
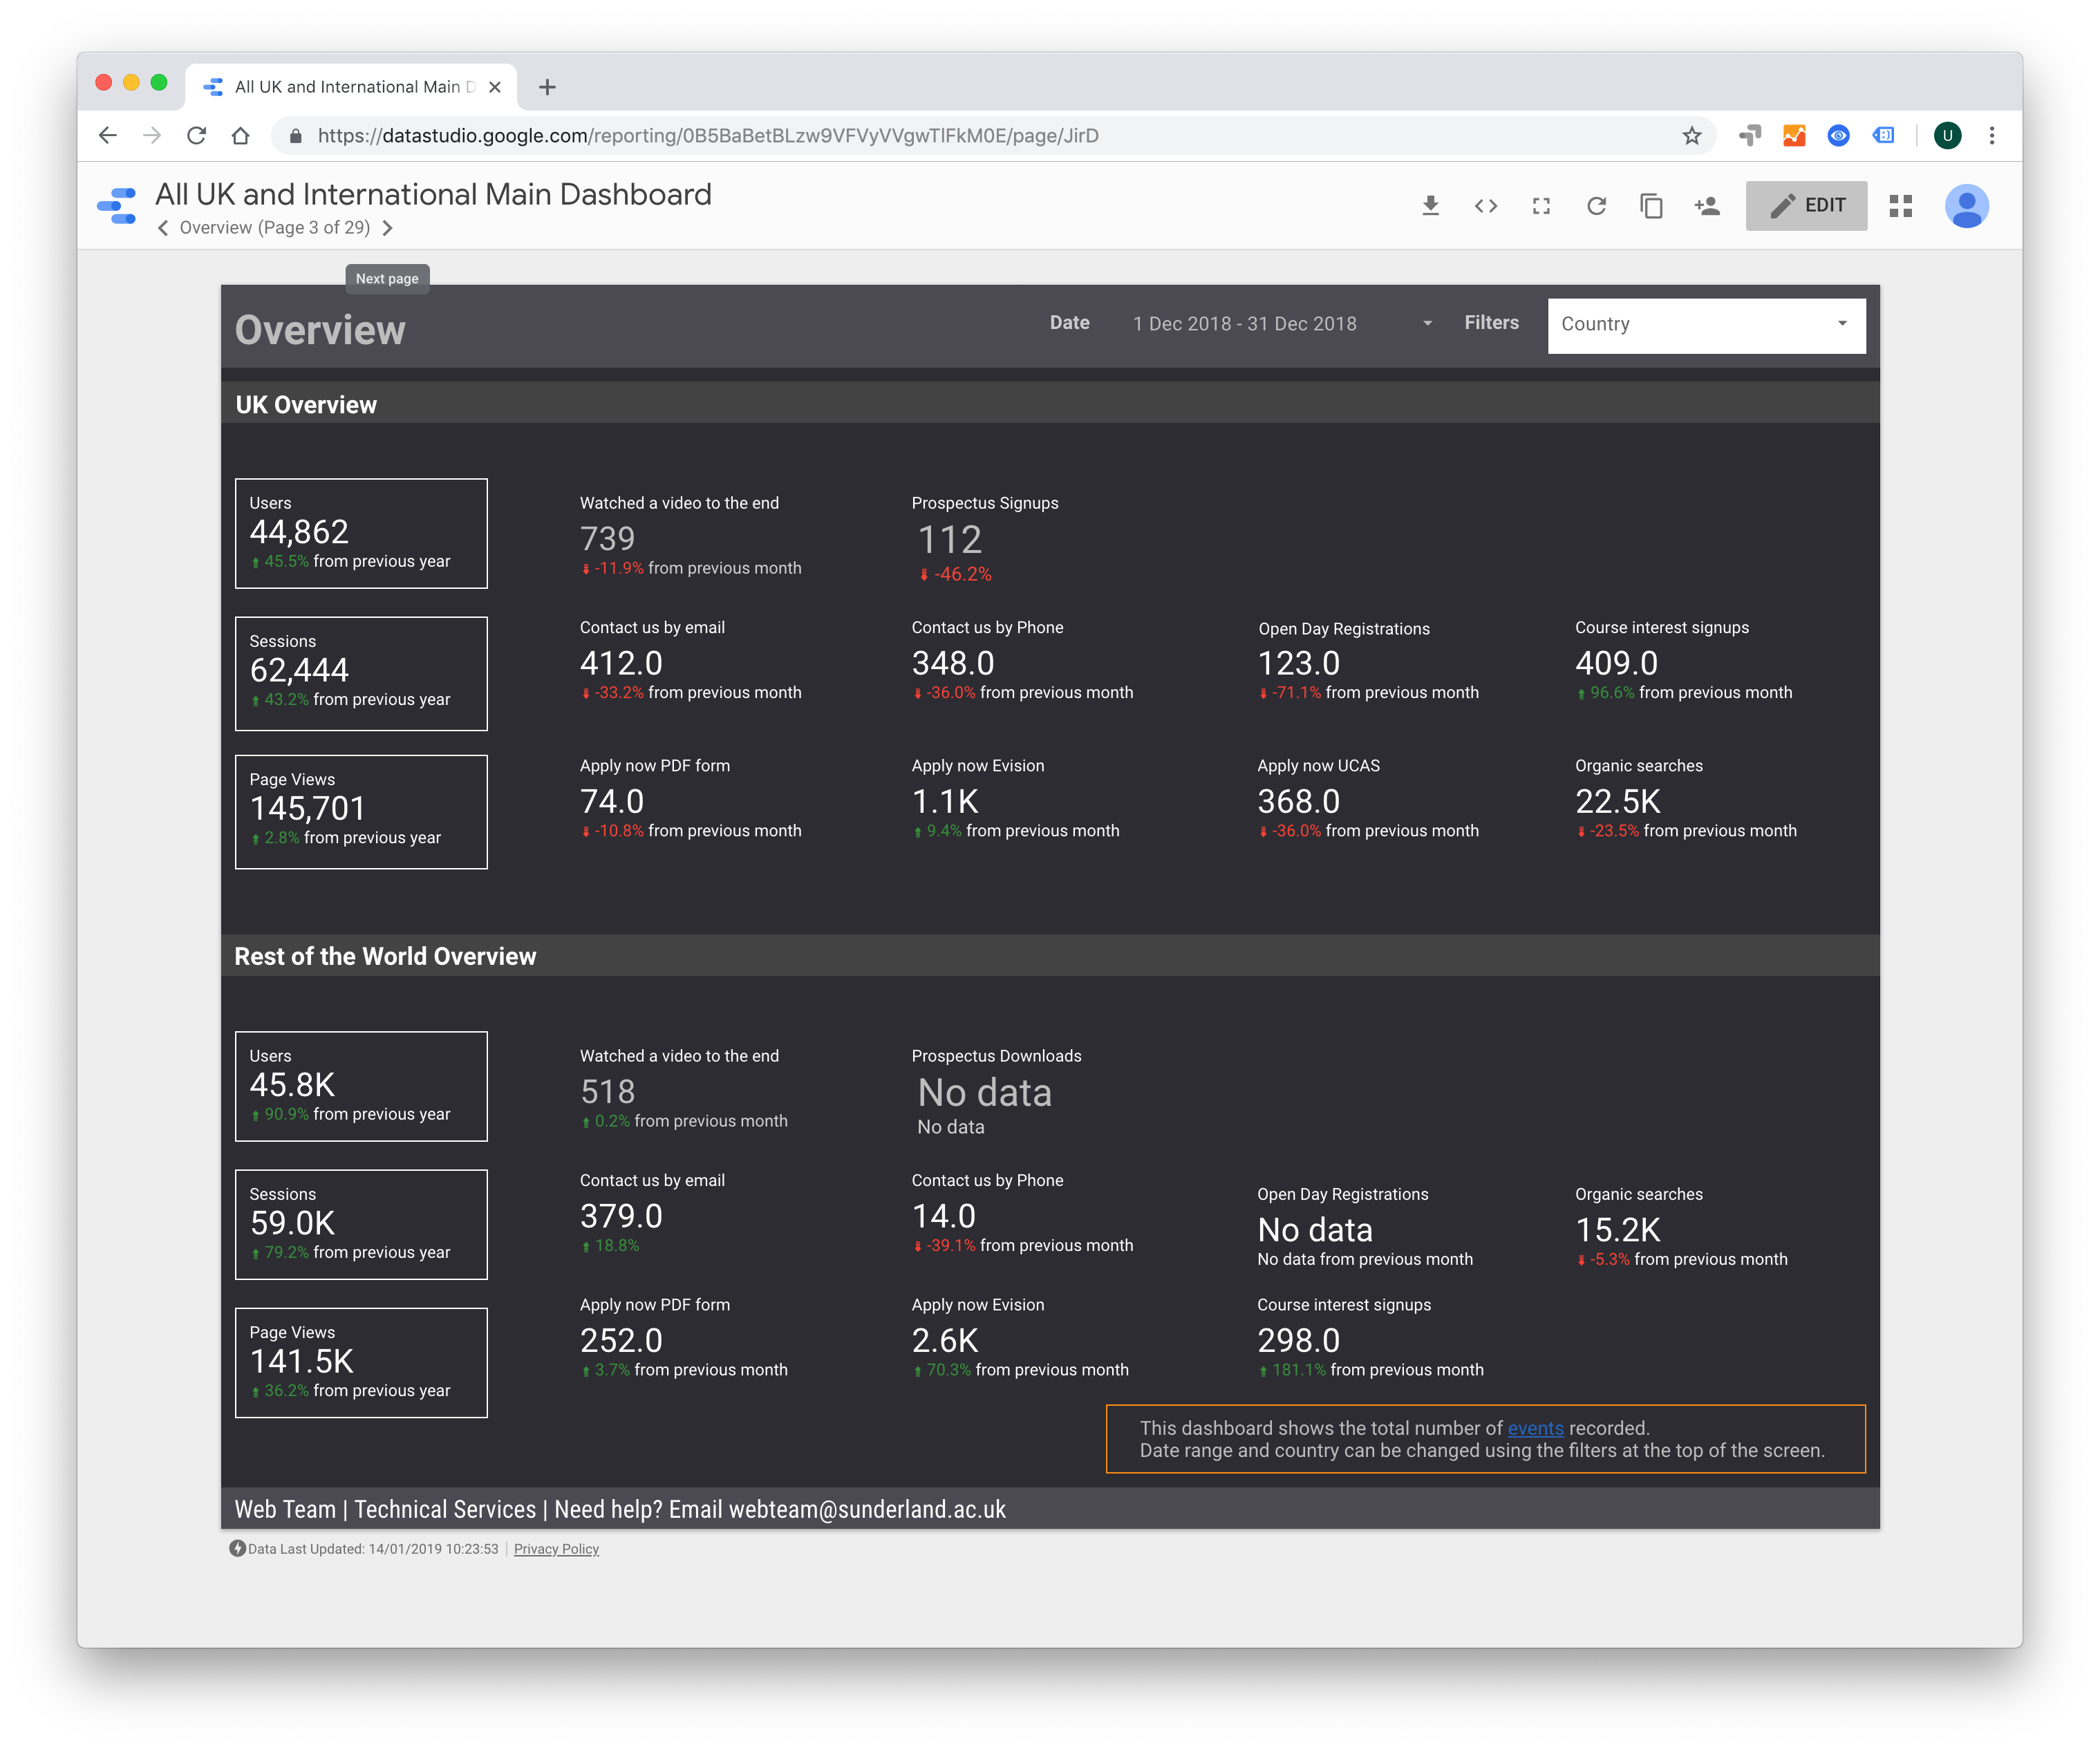
In this instance the performance dashboards give a more in depth look at who visits the website and what they do on it. Looking beyond the generics of who, what and when, and into the likes of how many people of viewed the content, how long they stayed on it, and if they interacted with anything as well, it gives a more detailed breakdown.
With this information you can evaluate what type of content is the most successful, and what is the least. Examples include how many people viewed the entirety of a video, where the user is from, and if they did something of note while using the website, such as order a prospectus or sign up to a course. This further insight enables more targeted ad campaigns, and you can assess percentages and what type of content does the best.
These dashboards give content Managers and Student Recruitment colleagues access to a wider range of data on web content performance that they can use to help them to make data-led decisions. They are used by different departments across the University, so everyone can track and analyse how their content is doing.
If you would like to have access to a performance dashboard showing information about your webpage, just contact the web team.